Global Volcanic Hotspots
Quantitative Analysis of Global Distribution and Impacts of Volcanic Hazards
This project is my coursework for PartIB Paper 1 Living With Global Change, which was awarded a First Class with Distinction (92/100).
1. Introduction
Volcanic hazards pose a major threat to human societies, with over 800 million people worldwide living within 100 km of an active volcano (Auker et al., 2013). These hazards vary widely, ranging from explosive eruptions that eject massive amounts of ash and pyroclastic material to slower-moving lava flows and secondary hazards such as lahars and tsunamis. Traditionally, volcanic hazard intensity has been quantified by Volcanic Explosivity Index (VEI), which ranks eruptions based on their magnitude and eruption column height (Newhall and Self, 1982). However, disaster severity does not always scale with eruption intensity; high-VEI eruptions can have minimal casualties, while moderate events may cause severe losses (Blong, 1984). This discrepancy suggests that factors beyond hazard magnitude play a crucial role in shaping disaster outcomes, raising important questions about the interplay between physical and socio-economic drivers of risk. Literature suggests a negative relationship between income per capita (RGDP, representing development level) and fatality, and a positive relationship between population density and fatality and population affected (Padli et al., 2018). However, these socio-economic factors are not systematically analyzed in conjunction with physical hazard metrics.
This study addresses these gaps with spatial and statistical quantitative methods, focusing on 3 main research questions:
(1) Mapping volcanic hazard hotspots and assessing their correlation with physical characteristics (VEI, volcano type, hazard type);
(2) Comparing hazard intensity (VEI) and human impact (fatalities, affected population) through spatial analysis and clustering;
(3) Determining key drivers of human impact (fatalities, affected population) by quantifying the relative influence of physical (VEI) and socio-economic (RGDP, population density) factors using regression models.
2. Data and methods
The analysis follows coursework guidelines requiring the use of EM-DAT (2024), yet its volcanic hazard data is highly limited. Of 277 records, only 12 entries have complete data across all variables (coordinate, deaths, affected population and economic loss), making it unsuitable for clustering and regression. Furthermore, EM-DAT lacks key volcanic hazard indicators (VEI, hazard) and socioeconomic factors (RGDP, population). To address these gaps, and as permitted by the coursework coordinator, I merged EM-DAT with other leading databases: Global Significant Volcanic Eruptions Database (GSVE, 2025), the Global Volcanic Program (GVP, 2025), and the Volcanic Disasters and Incidents Database (VDID, Witham, 2005) (Table 1). Given format variations (e.g., VDID are images, GVP requires online manual search), records were manually integrated and cross-validated. Population density data was sourced from the History Database of the Global Environment (HYDE, Goldewijk et al., 2017), which provides gridded historical estimates. RGDP was obtained from the Maddison Project Database (Bolt et al., 2024), which offers national-level approximations. The latter two were integrated in R.
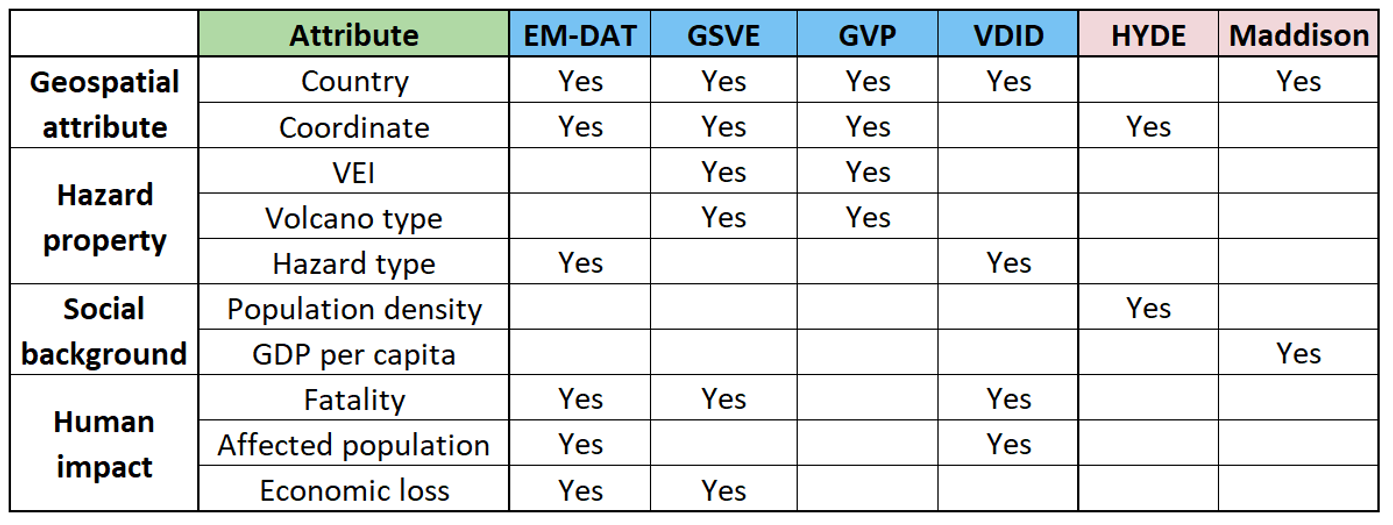
The final dataset comprises 721 records. Given the study’s interest in spatial patterns, only georeferenced entries (n=674) were analyzed (see Appendix). Although initially considered, economic loss was excluded due to insufficient data. Given the high skewness of most numerical variables (except VEI), I applied log-transformation to reduce the influence of extreme values, and applied standardization to ensure comparability across variables.
For question 1 and 2, I used Kernel Density Estimation (KDE), a spatial smoothing technique estimating event density across a continuous surface (Grekousis, 2020), to map hazard hotspots. I weighed KDE by VEI, fatality and affected population. The quartic kernel was chosen for localized smoothing, assigning greater influence to nearby events while minimizing long-range effects (Silverman, 2018). Bandwidth was set at 500 km to reflect the widespread impacts of volcanic hazards (BGS, 2012). To address duplicate event coordinates, an iterative jittering approach shifted each duplicate within ±0.0001° until all coordinates were unique. A seed was applied for reproducibility.
In addition to KDE, Question 1 implements chi-square tests of VEI and hazard/volcano type to further understand the hazard pattern, while Question 2 applies K-means cluster analysis to identify possible groupings between VEI and human impact. The Elbow method determined that the optimal cluster number is 4. Clusters were mapped and visualized in 3D.
For Question 3, two multivariable regression models were developed based on literature: (1) fatalities ~ VEI + population density + RGDP; (2) affected population ~ VEI + population density. Ordinary Least Squares (OLS) regression established baseline relationships, with all variance inflation factor (VIF) tests confirming no multicollinearity (< 1.1). Spatial autocorrelation, a measurement of non-random clustering of values, was assessed using Moran’s I (Rogerson, 2021). A significant Moran’s I would indicate a violation of OLS assumptions of independent observations (O’Sullivan and Unwin, 2010), necessitating the use of a spatial error model (SEM) to account for unobserved spatial dependencies.
3. Results
Question 1
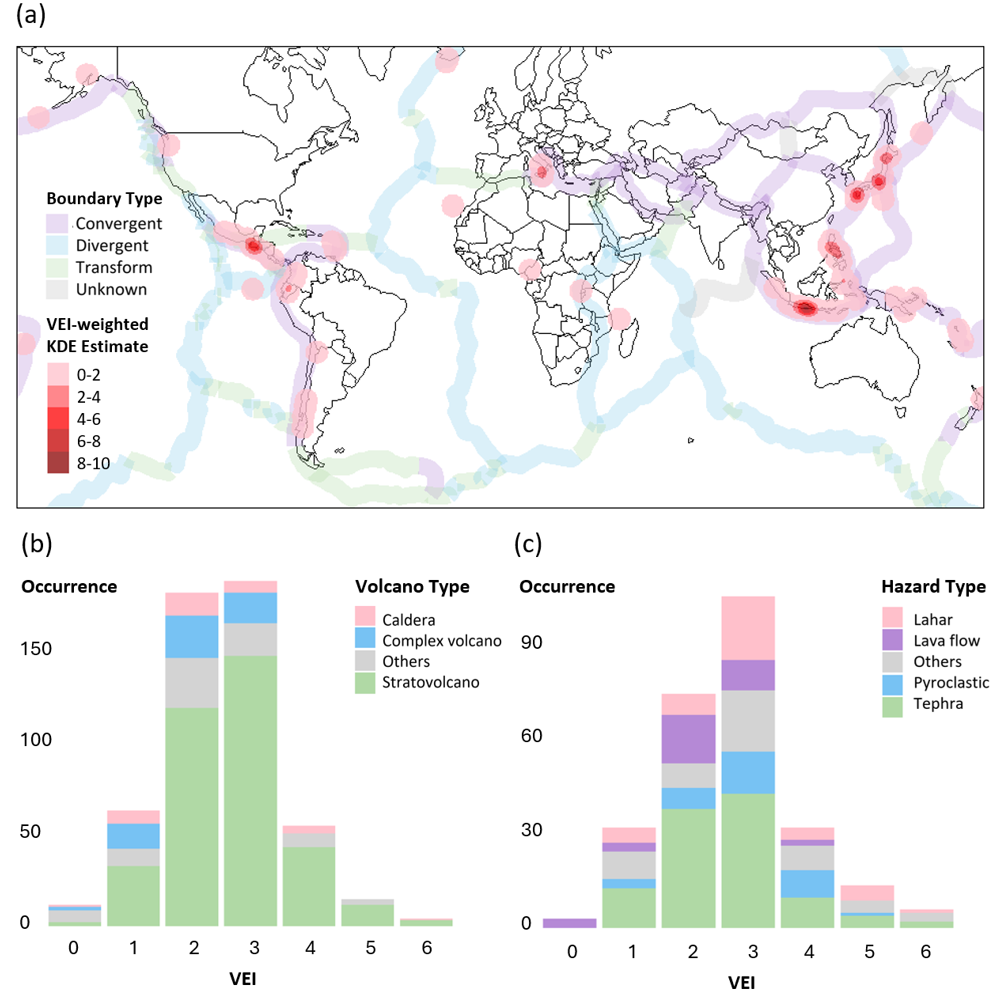
The VEI-weighted KDE map (Figure 1a) reveals major volcanic hotspots along the Pacific Ring of Fire, the Andean Volcanic Belt, and the Indonesian Arc. The highest KDE intensities (>6) closely align with convergent plate boundaries, while divergent boundaries, such as the East African Rift and Mid-Atlantic Ridge, show lower intensities (<2). VEI distribution by volcano type (Figure 1b) indicates that stratovolcanoes dominate across all VEI levels, particularly >3. Calderas and complex volcanoes rank second and third but are more common at low to medium VEIs. A Chi-squared test confirms a significant dependence between VEI and volcano type (X² = 206.63, p < 0.001). Hazard-type distribution (Figure 1c) shows tephra fallout, pyroclastic density currents, and lahar as the most frequent hazards, with lava flows more common at lower VEIs. Hazard type and VEI are also significantly associated (X² = 224.19, p < 0.001).
Question 2
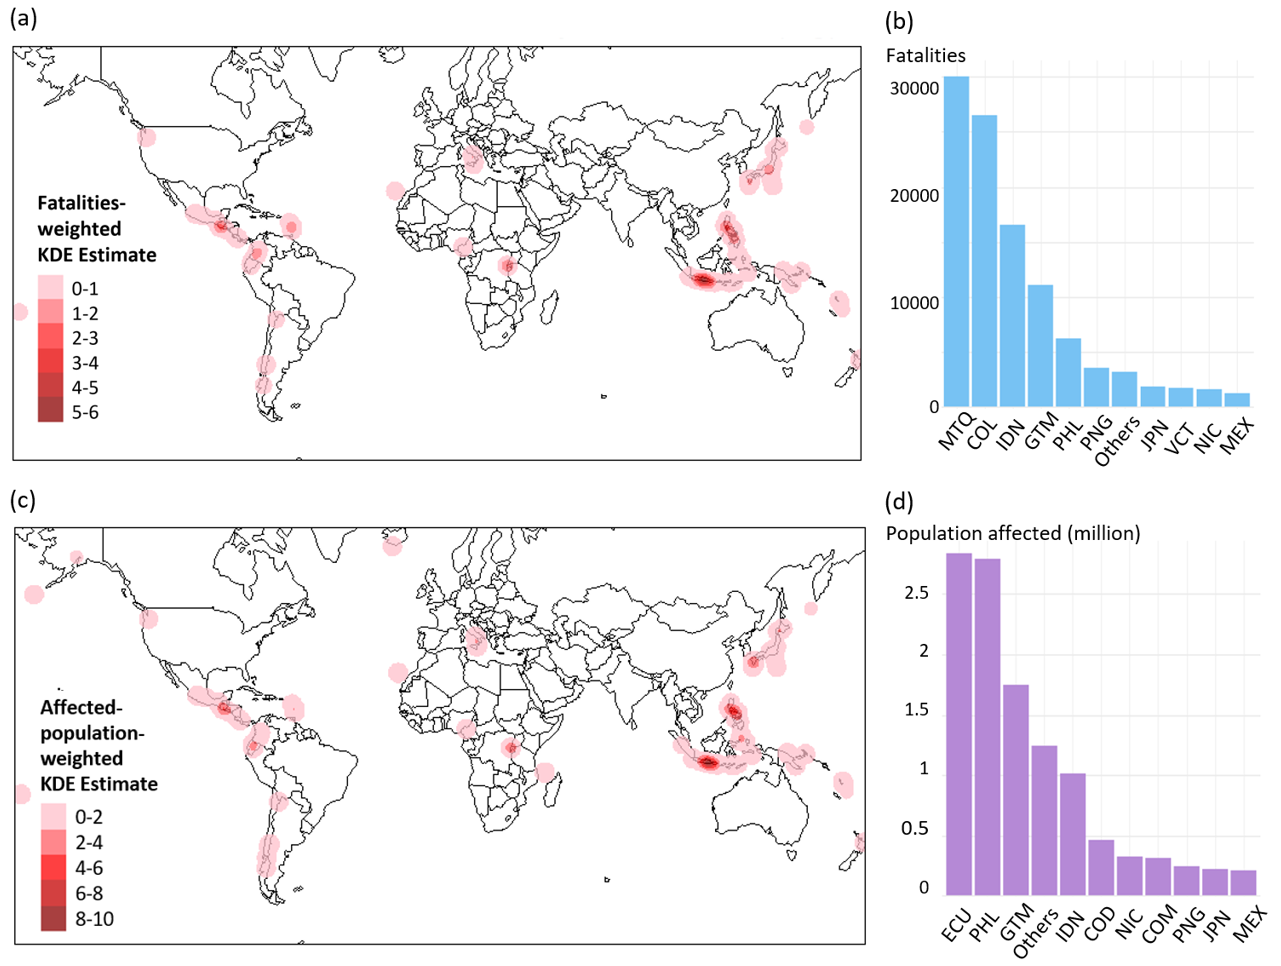
The human impact hotspots (Figure 2a, 2c) share similarities with VEI hotspots, with Indonesia, the Philippines, and Central America appearing in both. Japan and Italy, despite high VEI, show low human impact. Reversely, the East African Rift has low VEI but significant human impact. Differences between fatality- and population-affected-weighted KDE are minor, except for Martinique, which has high fatalities but a lower affected population. A clearer pattern is shown by the bar charts (Figure 2b, 2d): Martinique and Colombia have the highest fatalities yet not lead in affected population, while Ecuador and the Philippines lead in affected populations but report fewer fatalities. Guatemala ranks 4th in fatalities and 3rd in affected populations, indicating a dual high-risk zone.
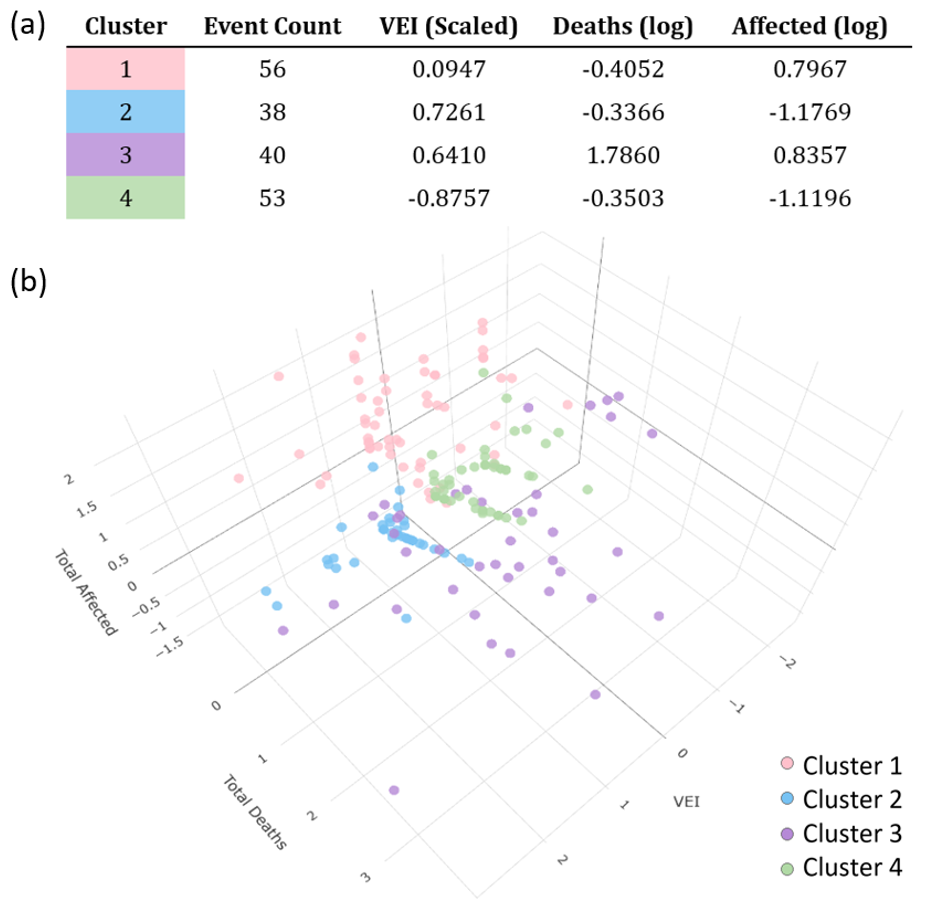
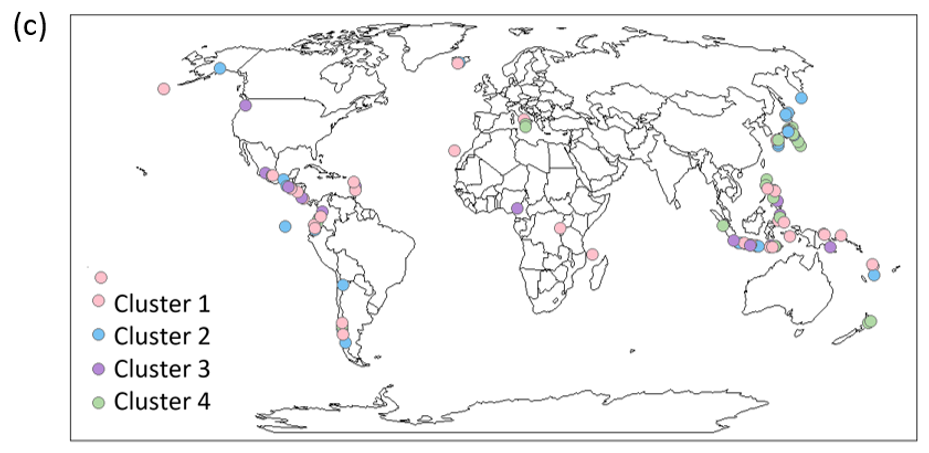
K-means (64% variance explained) identifies four clusters: Cluster 1 has moderate VEI, low fatalities, and moderate affected populations, mainly in Indonesia, the Philippines, and Central America. Cluster 2 consists of high VEI eruptions with low societal impact, found in Japan, Kamchatka, Alaska, Indonesia, and the Andes. Cluster 3 features moderate VEI events with high fatalities but moderate affected populations, concentrated in the Caribbean, Colombia, Papua New Guinea, and Indonesia. Cluster 4 comprises low VEI events with minimal fatalities and affected populations, mainly in New Zealand, Japan, Italy, and the Philippines (Figure 3).
Question 3
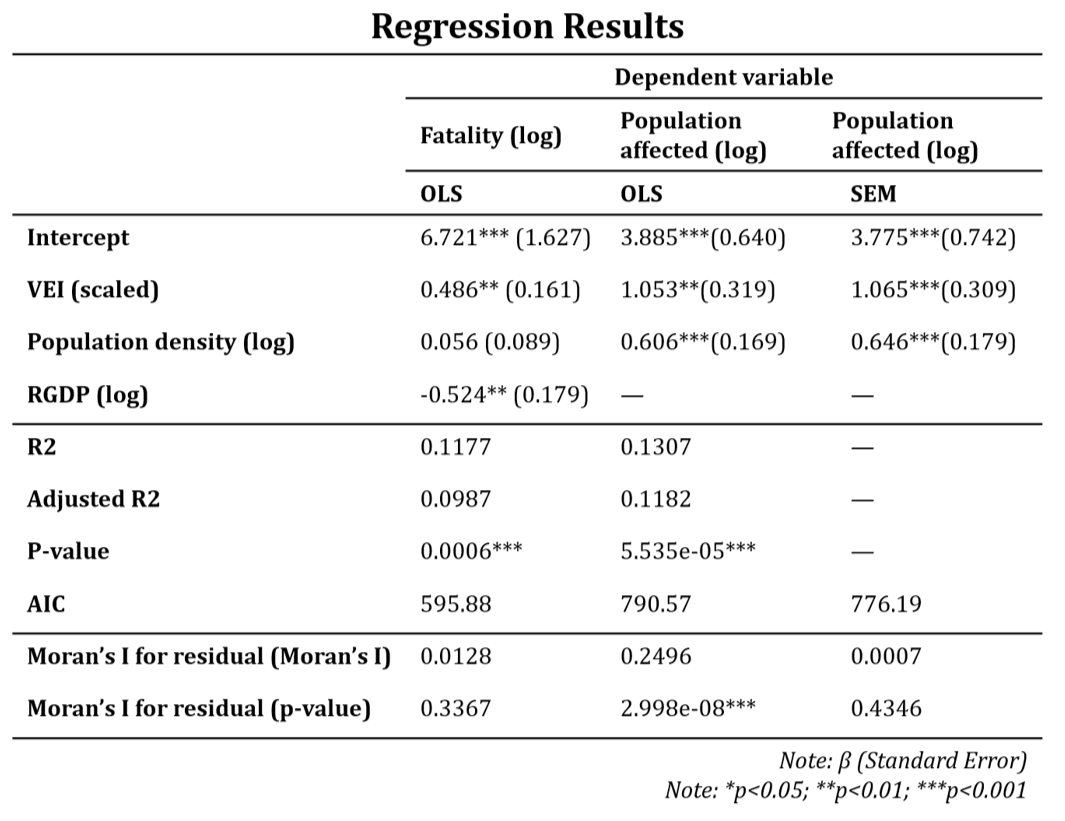
For fatalities (Table 2), VEI (β=0.486, p<0.01) and RGDP (β=−0.524, p<0.01) emerge as significant predictors, indicating that more explosive eruptions lead to higher deaths, while wealthier regions record fewer fatalities. Population density is not significant (p=0.527). The model is statistically significant (p=0.00056) but only explains 9.9% of the variance (adjusted R2=0.099). For affected population (Table 2), both VEI (β=1.053, p<0.01) and population density (β=0.606, p<0.001) are significant predictors, suggesting that more explosive eruptions and higher population densities correspond to a larger affected population. The model is significant but cannot explain all variance (p=5.535e-5, adjusted R2=0.118).
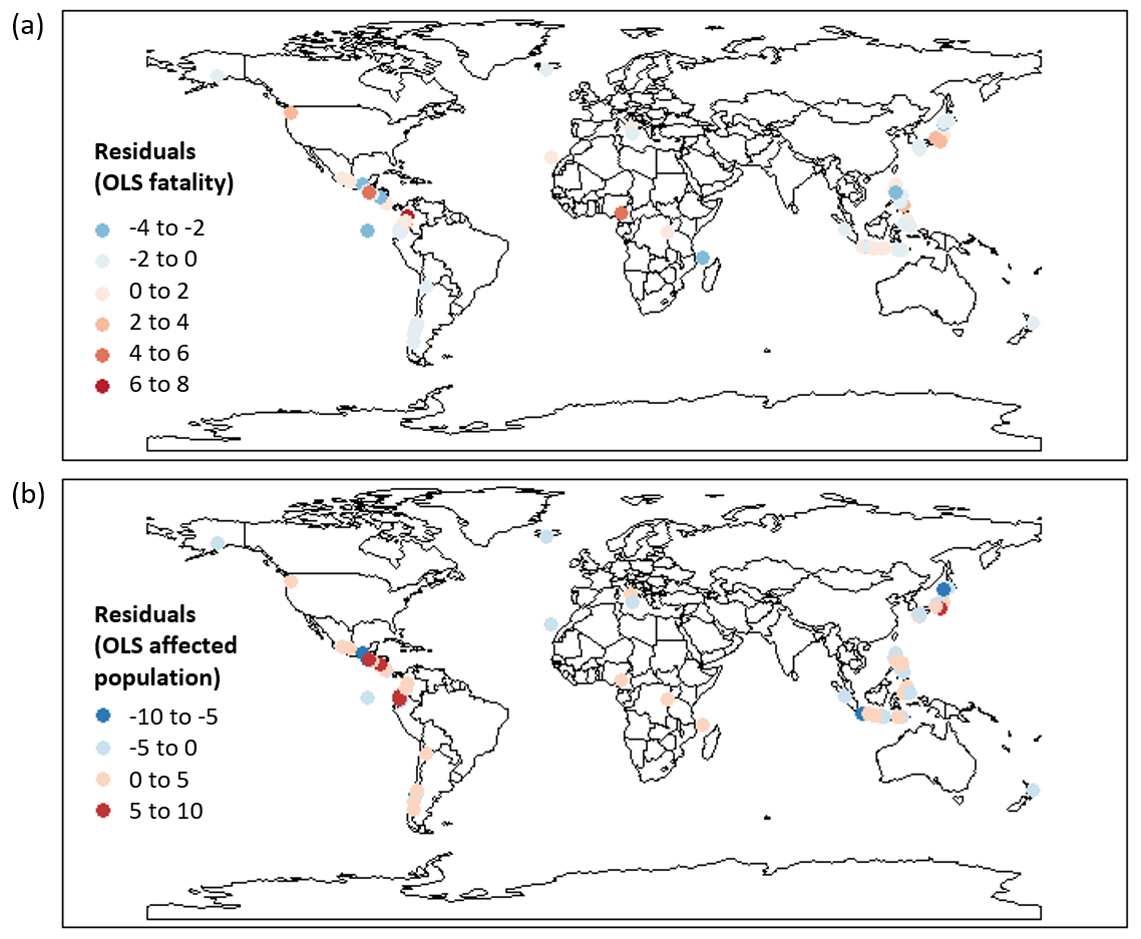
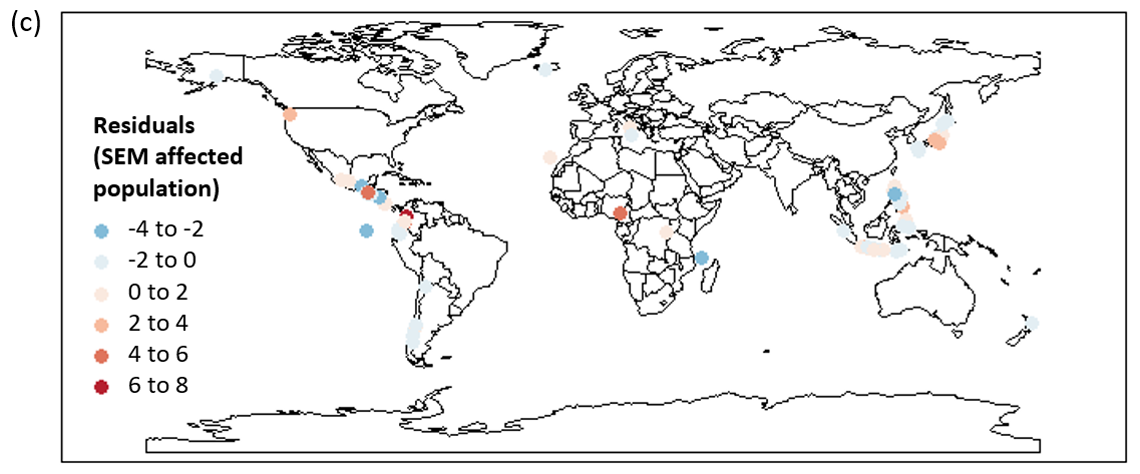
Moran’s I shows significant spatial clustering for affected population (I=0.232, p<0.001) and weaker clustering for fatalities (I=0.076, p=0.038). Residual tests confirm no spatial dependence for fatalities (I=0.0128, p=0.337) but persistent autocorrelation for the affected population (I=0.250, p<0.001), as mapped by Figure 4. A SEM was thus employed for affected population, reducing spatial clustering and improving model fit (reducing AIC from 790.57 to 776.19). The SEM reaffirms that VEI (β=1.065, p<0.001) and population density (β=0.646, p<0.001) remain positively associated with affected populations.
4. Results
Question 1
The VEI-weighted KDE map reveals strong clustering of high-intensity volcanic activity along subduction zones, where hydration melting generates volatile-rich, highly viscous, and explosive magmas (Francis et al., 2003). This explains the dominance of stratovolcanoes at high VEI levels - these steep-sided edifices form through repeated pyroclastic and lava accumulation at subduction zones. In contrast, low KDE values along divergent boundaries correspond to effusive basaltic eruptions driven by decompression melting (Oppenheimer, 2011). The link between hazard type and VEI is consistent to previous literature (Ogburn et al., 2023). Tephra, pyroclastic density currents, and lahars are most common across all VEI values (Pierson et al., 2014; Cole et al., 2015), while lava flow is more prevalent at low-VEI events since they are related to effusive eruption (Oppenheimer, 2011). Chi-squared test confirms significant associations between these physical characteristics, supporting their role in hazard prediction. However, the dataset primarily reflects historically active volcanoes with recorded human impact, potentially underrepresenting hazards from remote or prehistoric eruptions.
Question 2
While volcanic hazard distribution aligns with physical factors, its correlation with human impact is less consistent, as shown by KDE and k-means clustering. KDE highlights spatial differences, whereas k-means identifies event groupings. Firstly, Indonesia, the Philippines, and Central America appear as both VEI and human impact hotspots, overlapping with Cluster 3 (moderate VEI, high affected population, highest fatalities). However, while KDE emphasizes long-term risk zones, Cluster 3 includes catastrophic historical eruptions (e.g., Mount Pelée 1902, Nevado del Ruiz 1985). Secondly, Japan and Italy show low human impact despite high VEI, likely due to advanced mitigation strategies, aligning with Cluster 2 (high VEI, low fatalities), although the later also includes sparsely populated regions like Alaska.
While KDE highlights severe hazard zones, it overlooks moderate-risk areas. K-means better captures mixed-risk regions, such as Cluster 1 (moderate VEI, moderate impact) in densely populated zones and Cluster 4 (low VEI, low impact) in well-documented but less active regions like New Zealand and Italy. KDE’s failure to capture these patterns may also stem from log-transformation blurring discrepancies between fatalities and affected population.
However, KDE also reveals patterns missed by k-means, particularly in the East African Rift, where lower VEI coincides with substantial human impact, likely due to weak infrastructure, limited warning systems, or high population exposure. This region lacks a corresponding k-means cluster, possibly explained by limited event records. Given the significance of low-magnitude eruptions in an increasingly interconnected world (Mani et al., 2021), combining KDE and k-means would provide a more comprehensive understanding of hazard intensity and human impact.
Question 3
Regression analysis identifies VEI as a key predictor of fatalities and affected populations, confirming that more explosive eruptions intensify human impact. GDP negatively correlates with fatalities, suggesting wealthier regions experience lower mortality due to better infrastructure and preparedness. Population density predicts affected populations but not fatalities, implying widespread disruption in dense areas, while mortality depends on resilience and hazard preparedness. This contrasts with Padli et al. (2018), who found population density significant for both, warranting further study. Low R² values might be explained by the unprecise GDP (country-level) and population data (5 arc-minutes), but it might also suggest unaccounted factors, such as governance and evacuation efficiency, influence disaster severity (Lechner and Rouleau, 2019). Moran’s I tests reveal significant spatial dependence for affected populations, indicating unmodeled spatial influences. The SEM improves explanatory power, reducing residual spatial autocorrelation and achieving a lower AIC than OLS, although the original predictors (VEI and population density) are still proved significant.
5. Conclusion
This study quantitatively assesses the global distribution and impacts of volcanic hazards. While physical factors (volcano type, hazard type, boundary type) explain high-intensity hotspots, these do not always align with human impact patterns; KDE and k-means clustering reveal distinct groupings. Regression analysis highlights the role of socio-economic factors: GDP mitigates fatalities, whereas population density increases exposure. These findings challenge hazard-based risk assessments, underscoring the need for policymakers to integrate socio-economic resilience alongside hazard intensity in disaster mitigation.
However, limitations persist. Incomplete economic loss records constrain financial impact assessments, while national-level GDP masks local disparities. Future research could further refine vulnerability indicators, exploring indirect social and cultural disruptions (e.g., displacement). The interaction between volcano and other environmental dynamics is also worth investigate (Farquharson and Amelung, 2022). Ultimately, volcanic risk is shaped by both environmental change and societal conditions, requiring a multidimensional approach to mitigation.
6. Bibliography
Auker, M.R. et al. (2013) ‘A statistical analysis of the global historical volcanic fatalities record’, Journal of Applied Volcanology, 2(1), p. 2. Available at: https://doi.org/10.1186/2191-5040-2-2.
Blong, R.J. (1984) Volcanic Hazards: A Sourcebook on the Effects of Eruptions. Elsevier.
Bolt, Jutta; Van Zanden, Jan Luiten, 2024, “Maddison Project Database 2023”, https://doi.org/10.34894/INZBF2, DataverseNL, V1
British Geological Survey. 2012. Geohazard note: volcanic hazards. British Geological Survey.
Cole, P.D., Neri, A. and Baxter, P.J. (2015) ‘Chapter 54 - Hazards from Pyroclastic Density Currents’, in H. Sigurdsson (ed.) The Encyclopedia of Volcanoes (Second Edition). Amsterdam: Academic Press, pp. 943–956. Available at: https://doi.org/10.1016/B978-0-12-385938-9.00054-7.
CRED (2024) EM-DAT: The International Disaster Database. Université catholique de Louvain (UCLouvain). Available at: https://www.emdat.be (Accessed: 17 February 2025).
Esri. (2023). Tectonic Plate Boundaries. ArcGIS Hub. Retrieved February 1, 2025, from https://hub.arcgis.com
Farquharson, J.I. and Amelung, F. (2022) ‘Volcanic hazard exacerbated by future global warming-driven increase in heavy rainfall’, Royal Society Open Science, 9(7), p. 220275. Available at: https://doi.org/10.1098/rsos.220275.
Francis, T.L.P. et al. (2003) Volcanoes. Second Edition, Second Edition. Oxford, New York: Oxford University Press.
Grekousis, G. (2020) Spatial Analysis Methods and Practice: Describe – Explore – Explain through GIS. Cambridge: Cambridge University Press. Available at: https://doi.org/10.1017/9781108614528.
Hastangka and Suprapto (2023) ‘Conception and Perception of Indigenous People on Merapi Volcano Eruption: Knowledge, Philosophy, and Indigenous Education on Disaster Risk Reduction in Indonesia’, in G.K. Panda et al. (eds) Indigenous Knowledge and Disaster Risk Reduction: Insight Towards Perception, Response, Adaptation and Sustainability. Cham: Springer International Publishing, pp. 35–59. Available at: https://doi.org/10.1007/978-3-031-26143-5_3.
NCEI (2025) NCEI/WDS Global Significant Volcanic Eruptions Database, 4360 BC to Present. Available at: https://www.ncei.noaa.gov/access/metadata/landing-page/bin/iso?id=gov.noaa.ngdc.mgg.hazards:G10147 (Accessed: 16 February 2025).
| Smithsonian Institution (2025) Global Volcanism Program, Smithsonian Institution | Global Volcanism Program. Global Volcanism Program, National Museum of Natural History, MRC 119, Smithsonian Institution,. Available at: https://volcano.si.edu/ (Accessed: 16 February 2025). |
Klein Goldewijk, C.G.M., Beusen, A., Doelman, J., Stehfest, E. (2017) “Anthropogenic land use estimates for the Holocene – HYDE 3.2”, Earth Syst. Sci. Data, 9, 927–953
Lechner, H.N. and Rouleau, M.D. (2019) ‘Should we stay or should we go now? Factors affecting evacuation decisions at Pacaya volcano, Guatemala’, International Journal of Disaster Risk Reduction, 40, p. 101160. Available at: https://doi.org/10.1016/j.ijdrr.2019.101160.
Mani, L., Tzachor, A. and Cole, P. (2021) ‘Global catastrophic risk from lower magnitude volcanic eruptions’, Nature Communications, 12(1), p. 4756. Available at: https://doi.org/10.1038/s41467-021-25021-8.
Newhall, C.G. and Self, S. (1982) ‘The volcanic explosivity index (VEI) an estimate of explosive magnitude for historical volcanism’, Journal of Geophysical Research: Oceans, 87(C2), pp. 1231–1238. Available at: https://doi.org/10.1029/JC087iC02p01231.
Ogburn, S.E. et al. (2023) ‘The Volcanic Hazard Maps Database: an initiative of the IAVCEI Commission on Volcanic Hazards and Risk’, Journal of Applied Volcanology, 12(1), p. 2. Available at: https://doi.org/10.1186/s13617-022-00128-9.
Oppenheimer, C. (2011) Eruptions that shook the world. Cambridge, UK ; New York: Cambridge University Press. O’Sullivan, D., & Unwin, D. J. (2010). Area objects and spatial autocorrelation. Geographic information analysis. John Wiley & Sons, Hoboken, New Jersey, USA, 187-214
Padli, J., Habibullah, M.S. and Baharom, A.H. (2018) ‘The impact of human development on natural disaster fatalities and damage: panel data evidence’, Economic Research-Ekonomska Istraživanja, 31(1), pp. 1557–1573. Available at: https://doi.org/10.1080/1331677X.2018.1504689.
Pierson, T.C., Wood, N.J. and Driedger, C.L. (2014) ‘Reducing risk from lahar hazards: concepts, case studies, and roles for scientists’, Journal of Applied Volcanology, 3(1), p. 16. Available at: https://doi.org/10.1186/s13617-014-0016-4.
Robock, A. (2000) ‘Volcanic Eruptions and Climate’, Reviews of Geophysics [Preprint].
Rogerson, P.A. (2021) ‘Spatial Statistical Methods for Geography’, pp. 1–256.
Silverman, B.W. (2018) Density Estimation for Statistics and Data Analysis. New York: Routledge. Available at: https://doi.org/10.1201/9781315140919.
Singgih, B.A. and Asano, J. (2019) ‘Study on Impact of Relocating Settlement as a Post-Disaster Mitigation’, Urban and Regional Planning Review, 6, pp. 111–124. Available at: https://doi.org/10.14398/urpr.6.111.
Swindles, G.T. et al. (2017) ‘Climatic control on Icelandic volcanic activity during the mid-Holocene’, Geology, 46(1), pp. 47–50. Available at: https://doi.org/10.1130/G39633.1.
Witham, C.S. (2005) ‘Volcanic disasters and incidents: A new database’, Journal of Volcanology and Geothermal Research, 148(3), pp. 191–233. Available at: https://doi.org/10.1016/j.jvolgeores.2005.04.017.